Temporalog Dashboard
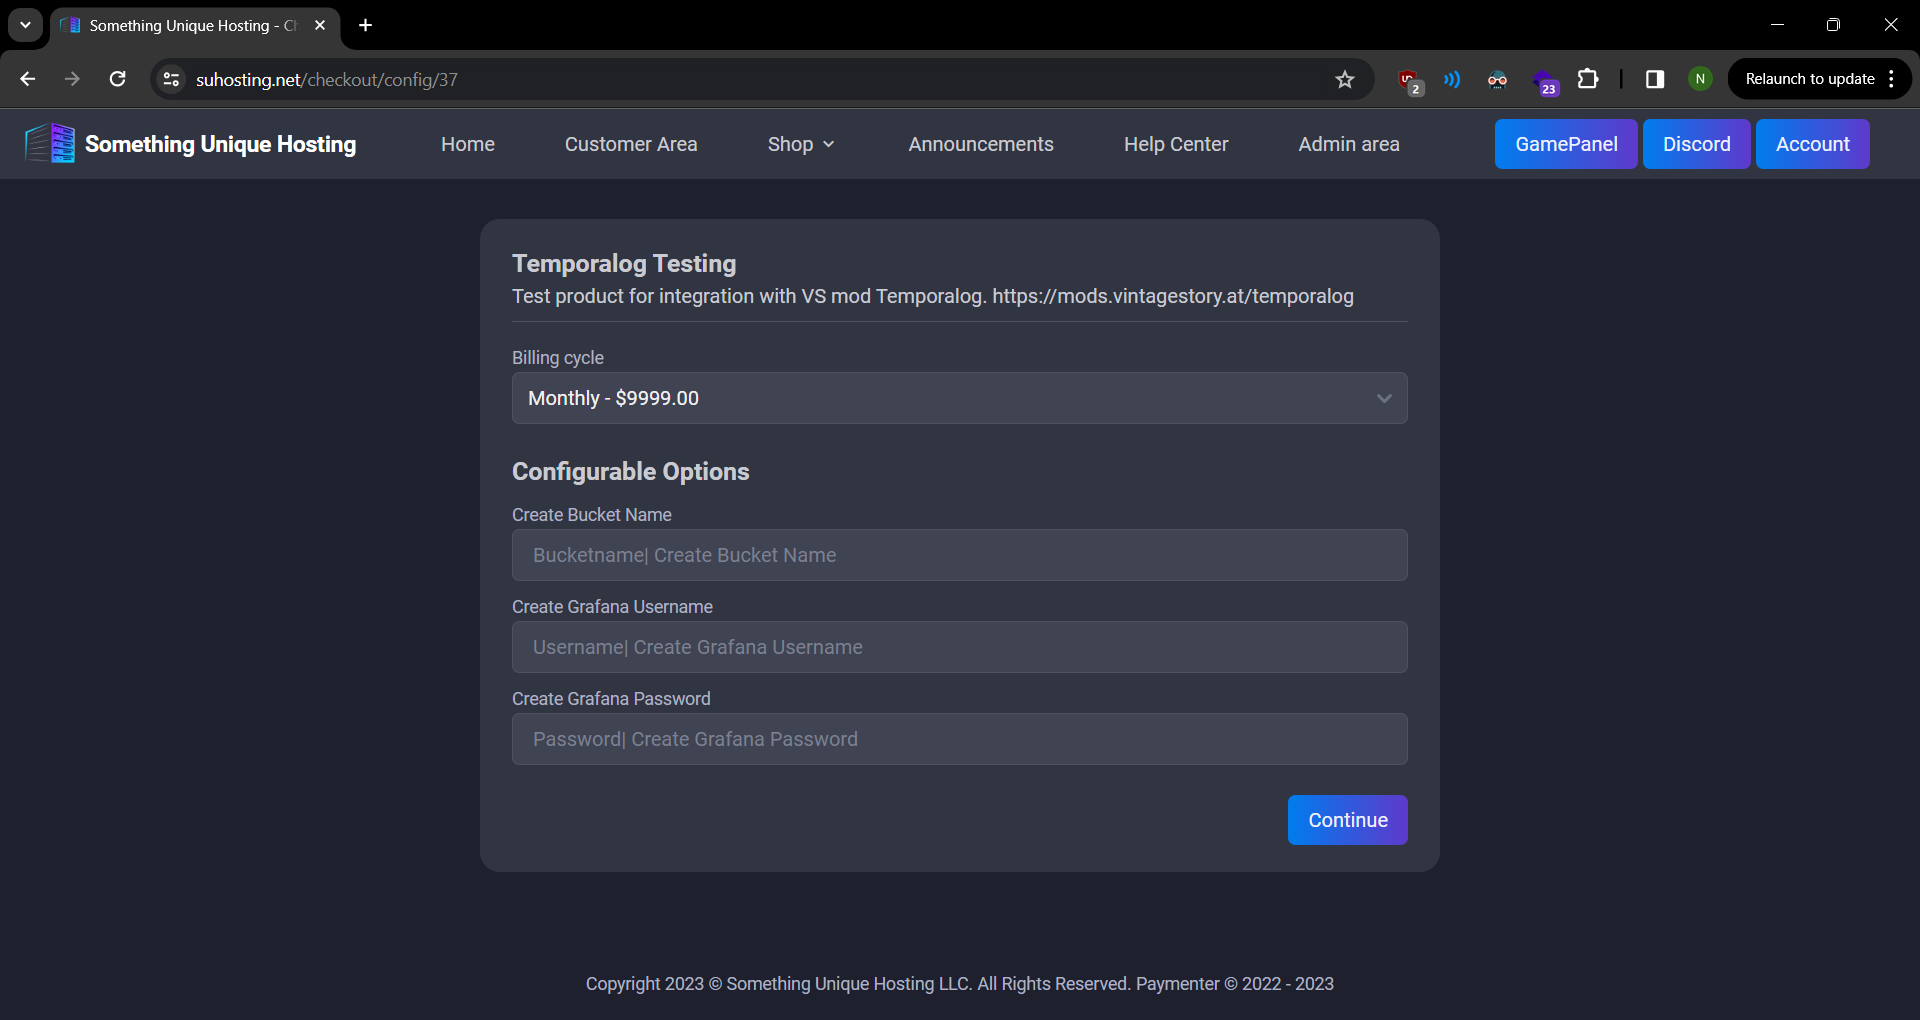
When you add the Temporalog Dashboard to your cart we need to collect some information from you to create it.
- Bucket name: You can make this name whatever you'd like but keeping it relevant to you is helpful for tracking issues later. Your username or server name are great choices.
- Grafana Username: This is your username to login to the Grafana dashboard. This can be whatever you'd like. At this time we don't support logging in with the same info as the panel or the billing panel. This is something we're actively working on
- Grafana Password: This is your password to login to the Grafana dashboard. This can be whatever you'd like but we suggest keeping it separate from the billing and game panel for security reasons.
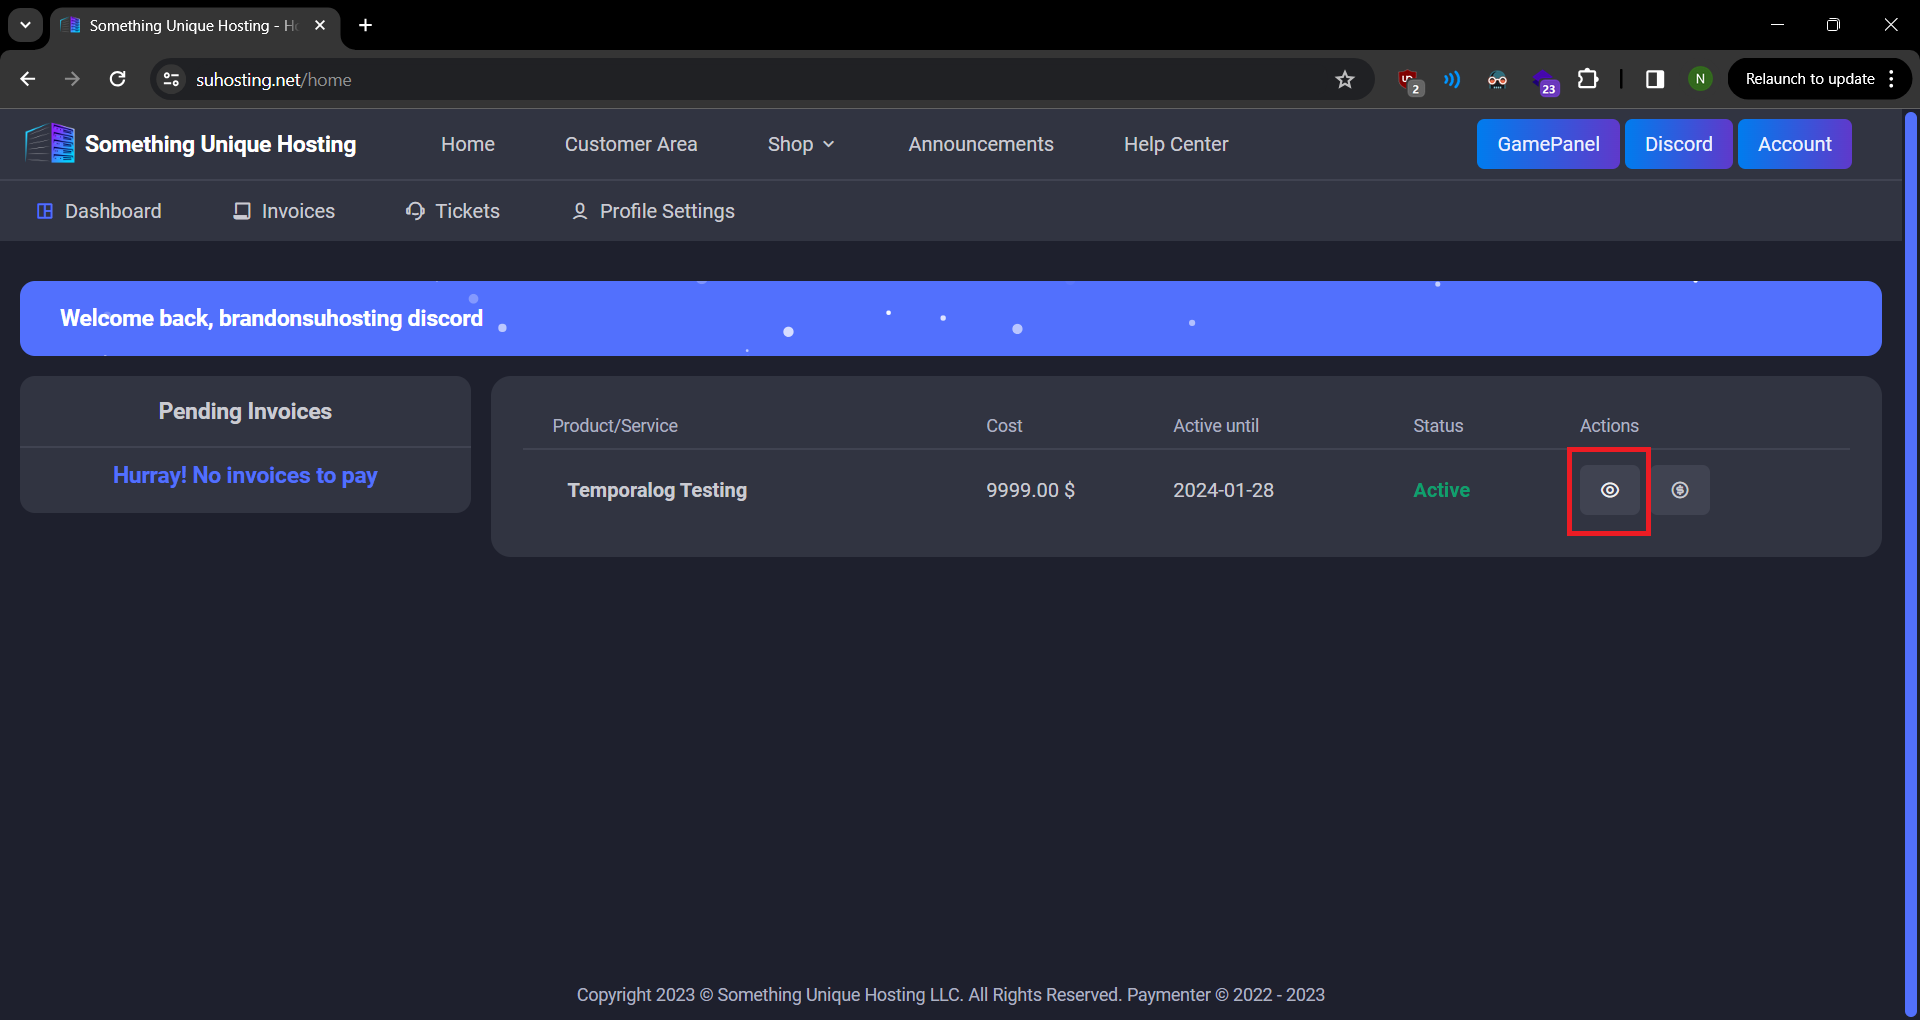
After you create your order you will be taken to the client dashboard. Click button in the red square for the Temporalog Product we just purchased to continue.
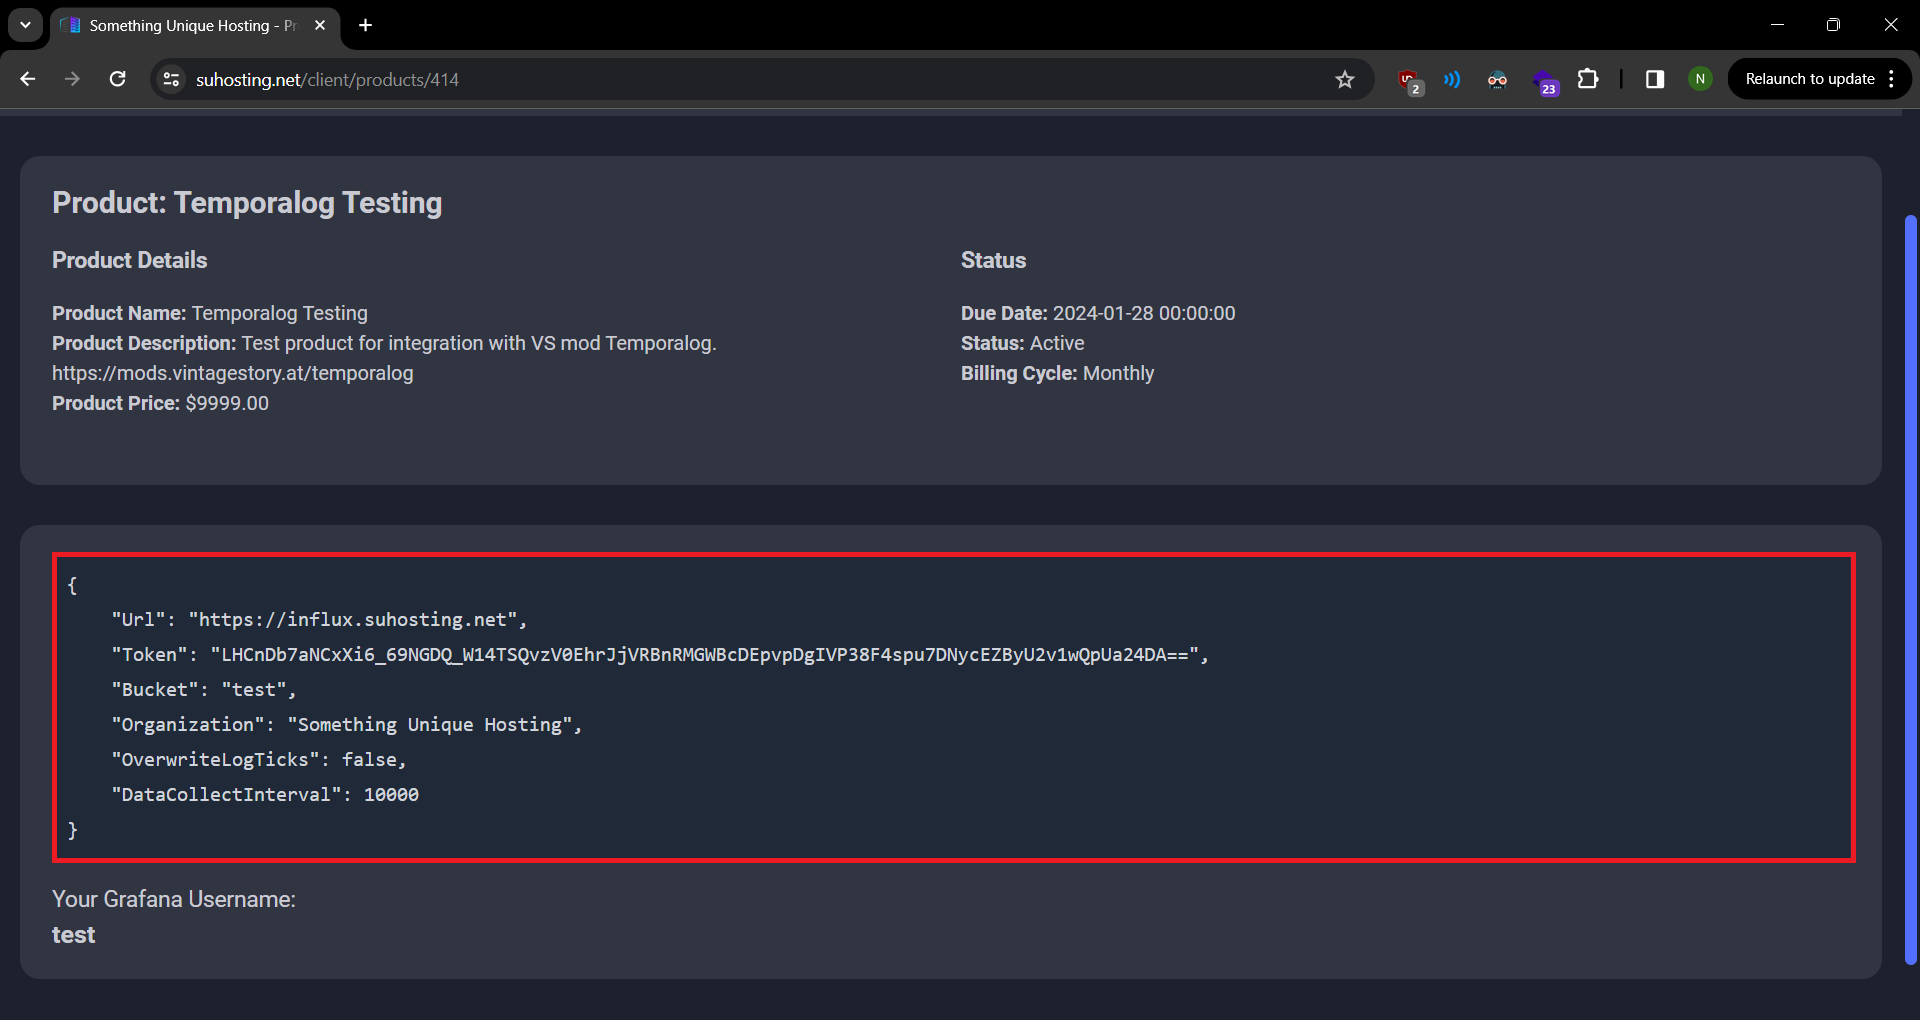
This is the info page for your product. Here we can find pre-generated json that we will use for the Temporalog mod. Additionally we also show your Grafana Username incase you ever need it. Simply click anywhere with the darkgray background (highlighted in the red box) to copy the text to your clipboard.
If you're using our hosting service please continue with the next section, otherwise you may skip this section.
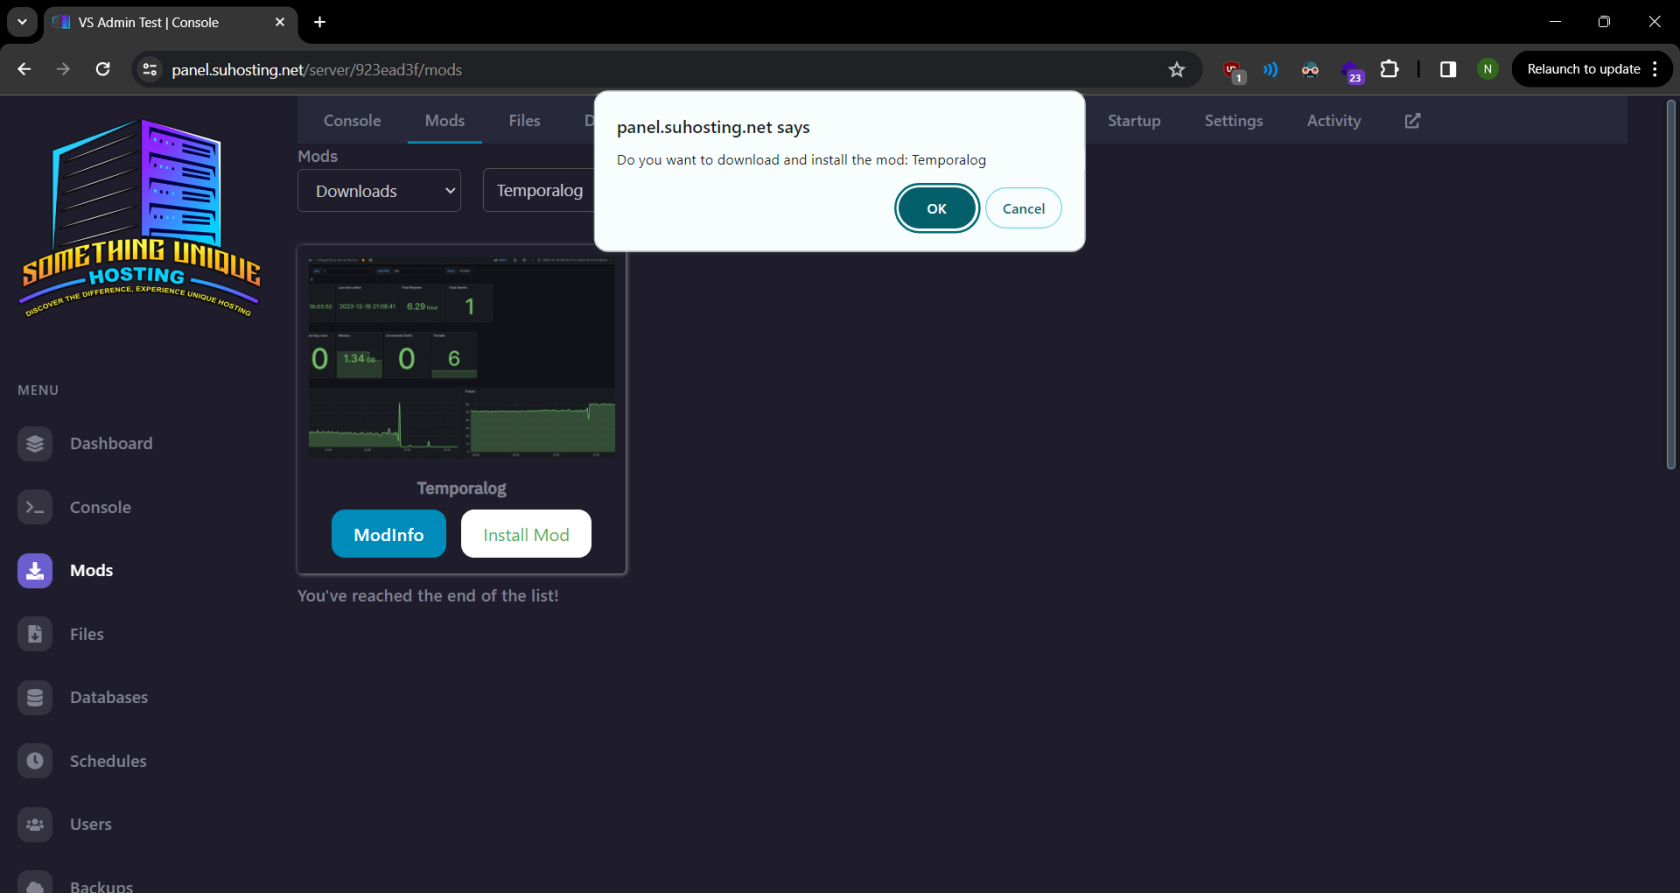
Go to our game panel and head to the mods tab. Type "Temporalog" into the search text box and hit "Install Mod" to install the mod directly to your server, click "OK" on the pop up. Within a few seconds you should get a "Mod installed successfully!" popup, if you don't and are unable to continue please submit a ticket or contact us on our discord for assistance.
Now that we have the mod installed we have to start and then stop our server so the mod can create it's config folder. Once this is done head over to the "Files" tab.
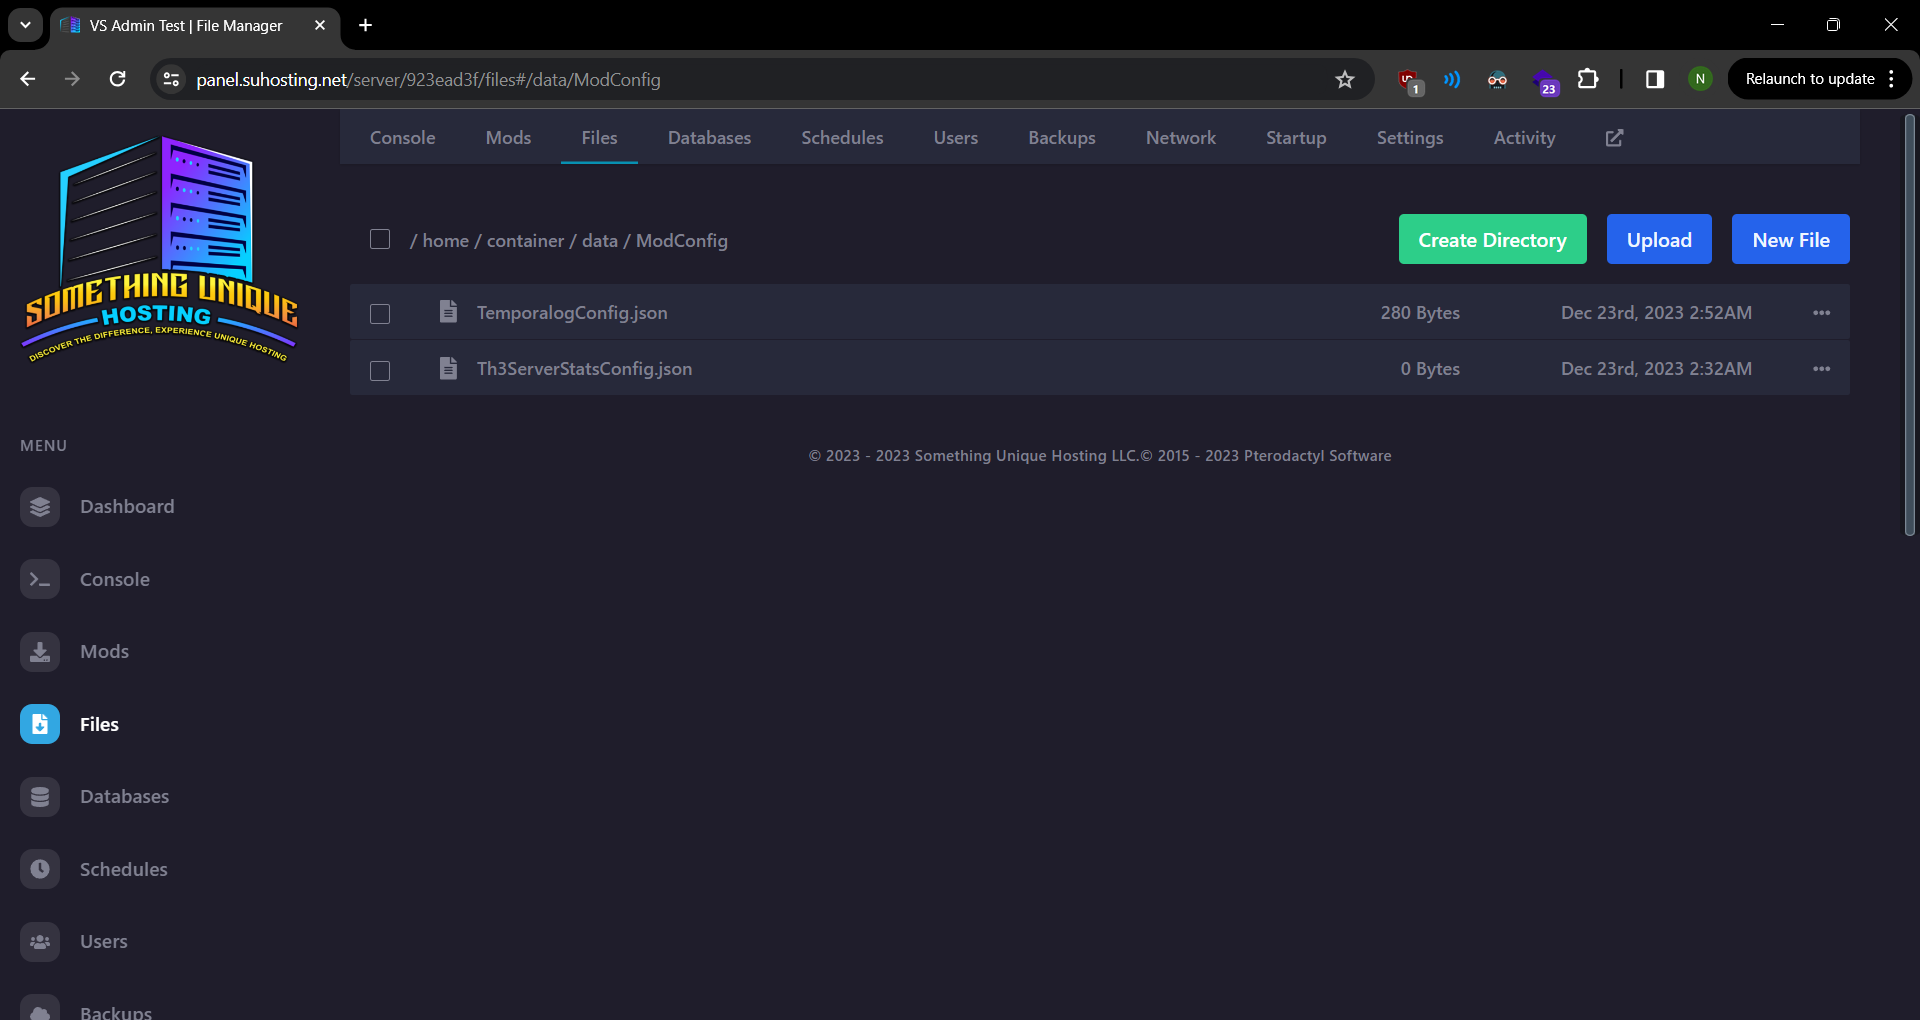
Once here click the "data" folder and then the "ModConfig" folder. Inside you should have the files above (or more depending on what mods you have installed). We're looking for the "TemporalogConfig.json" file. Simply click it to enter the editor.
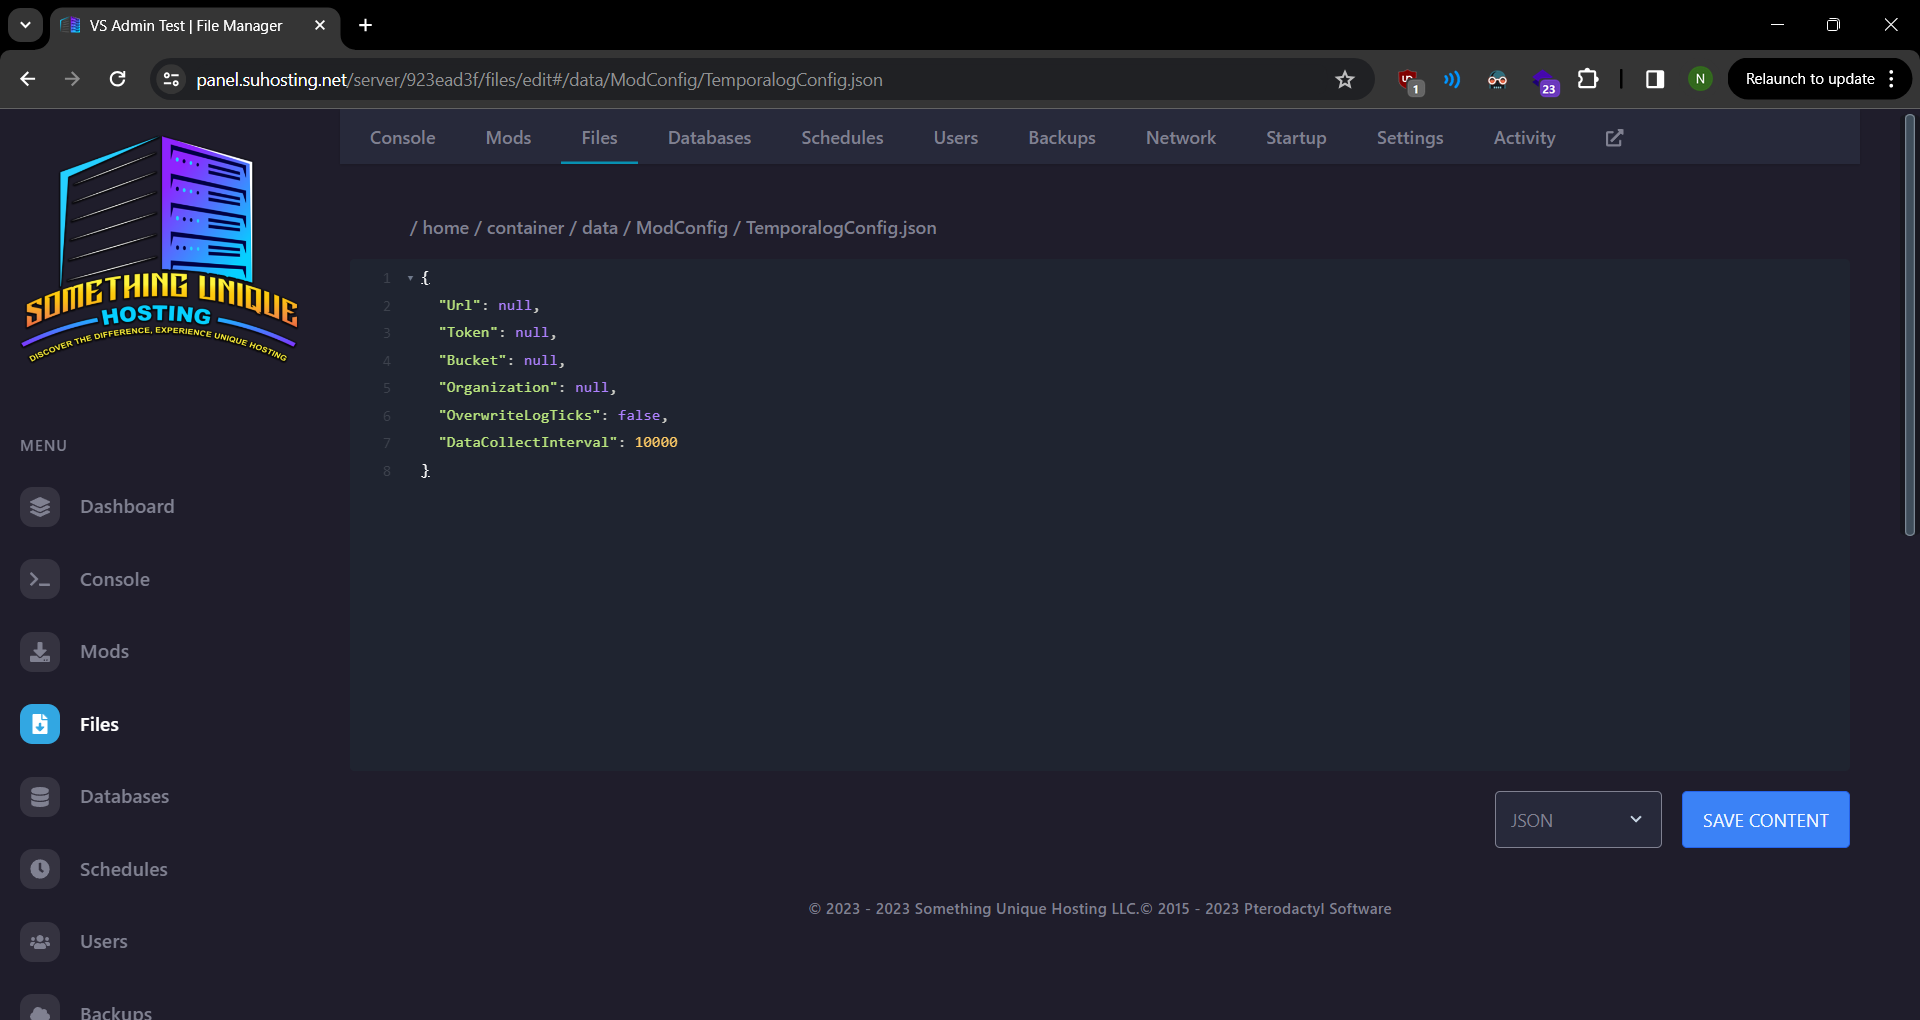
We should now see the default config that Temporalog has created. Now select all of the text and paste the config we copied to our clipboard from the billing panel earlier.
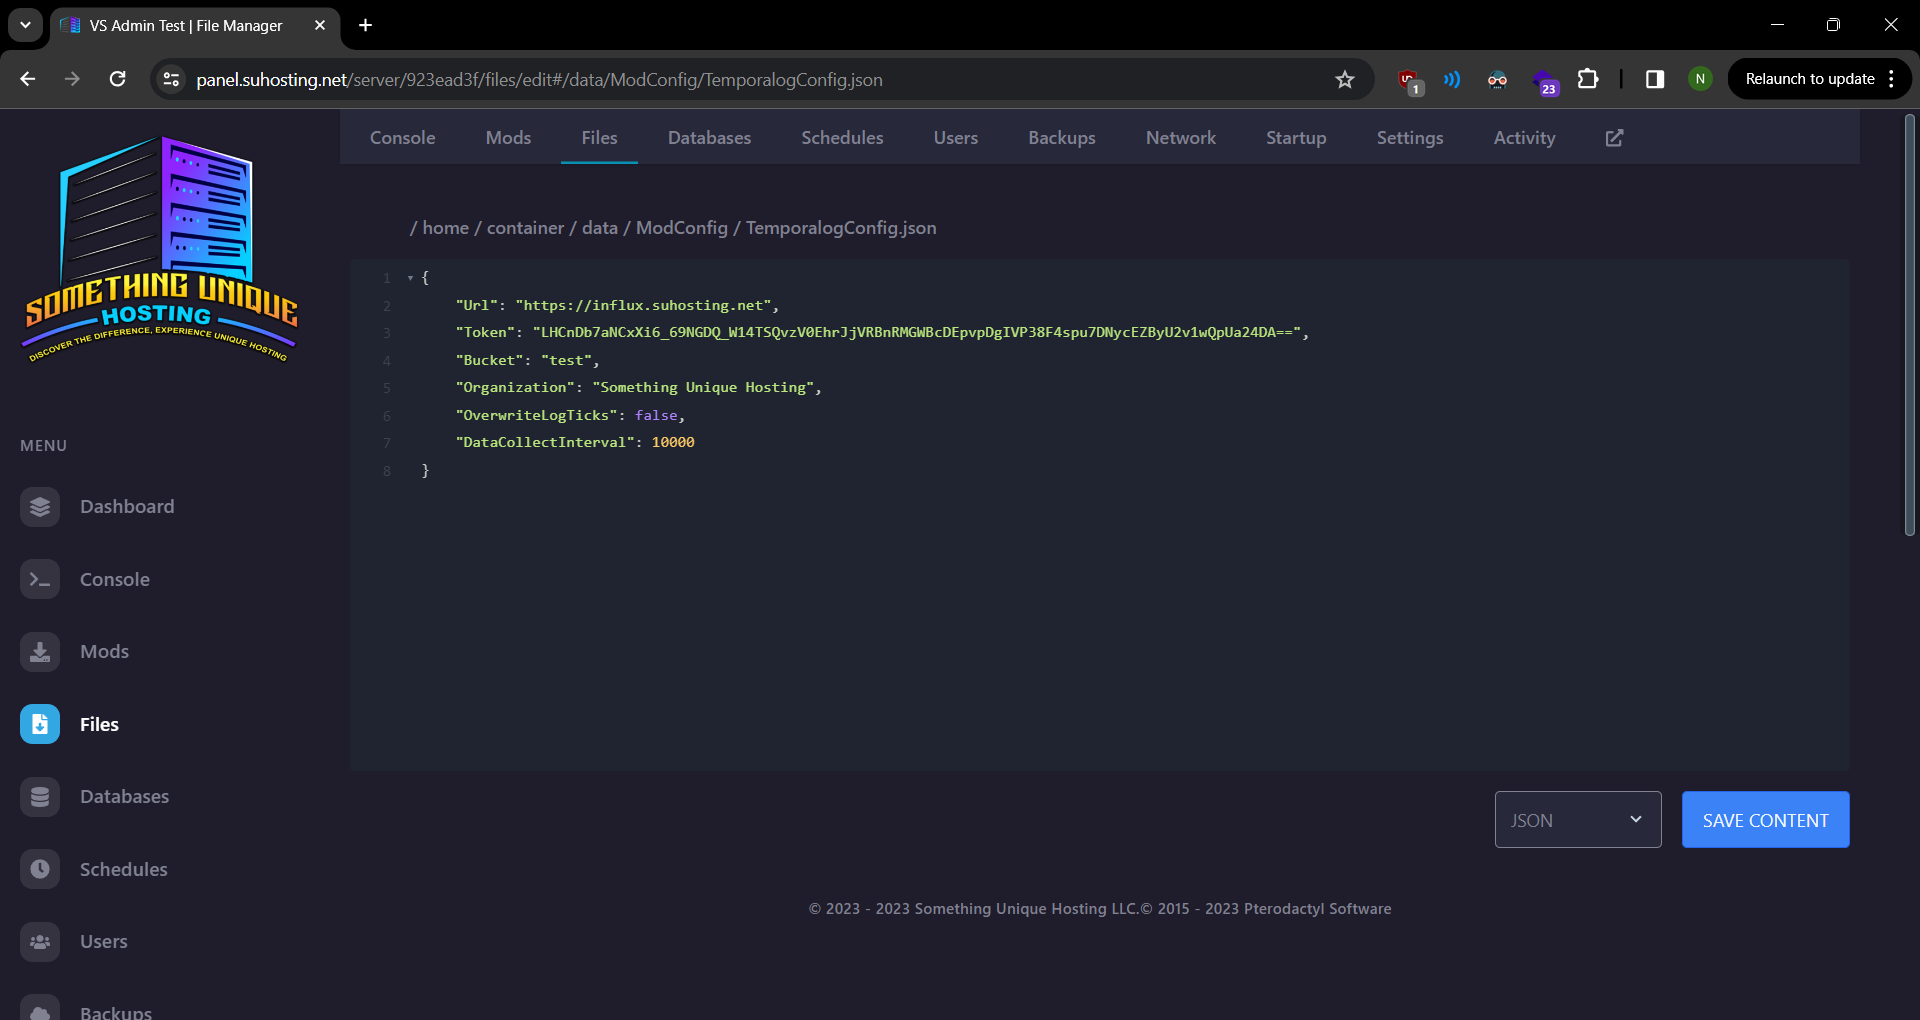
All of our fields should now be filled in. After we're done click the "Save Content" button and then start your server!
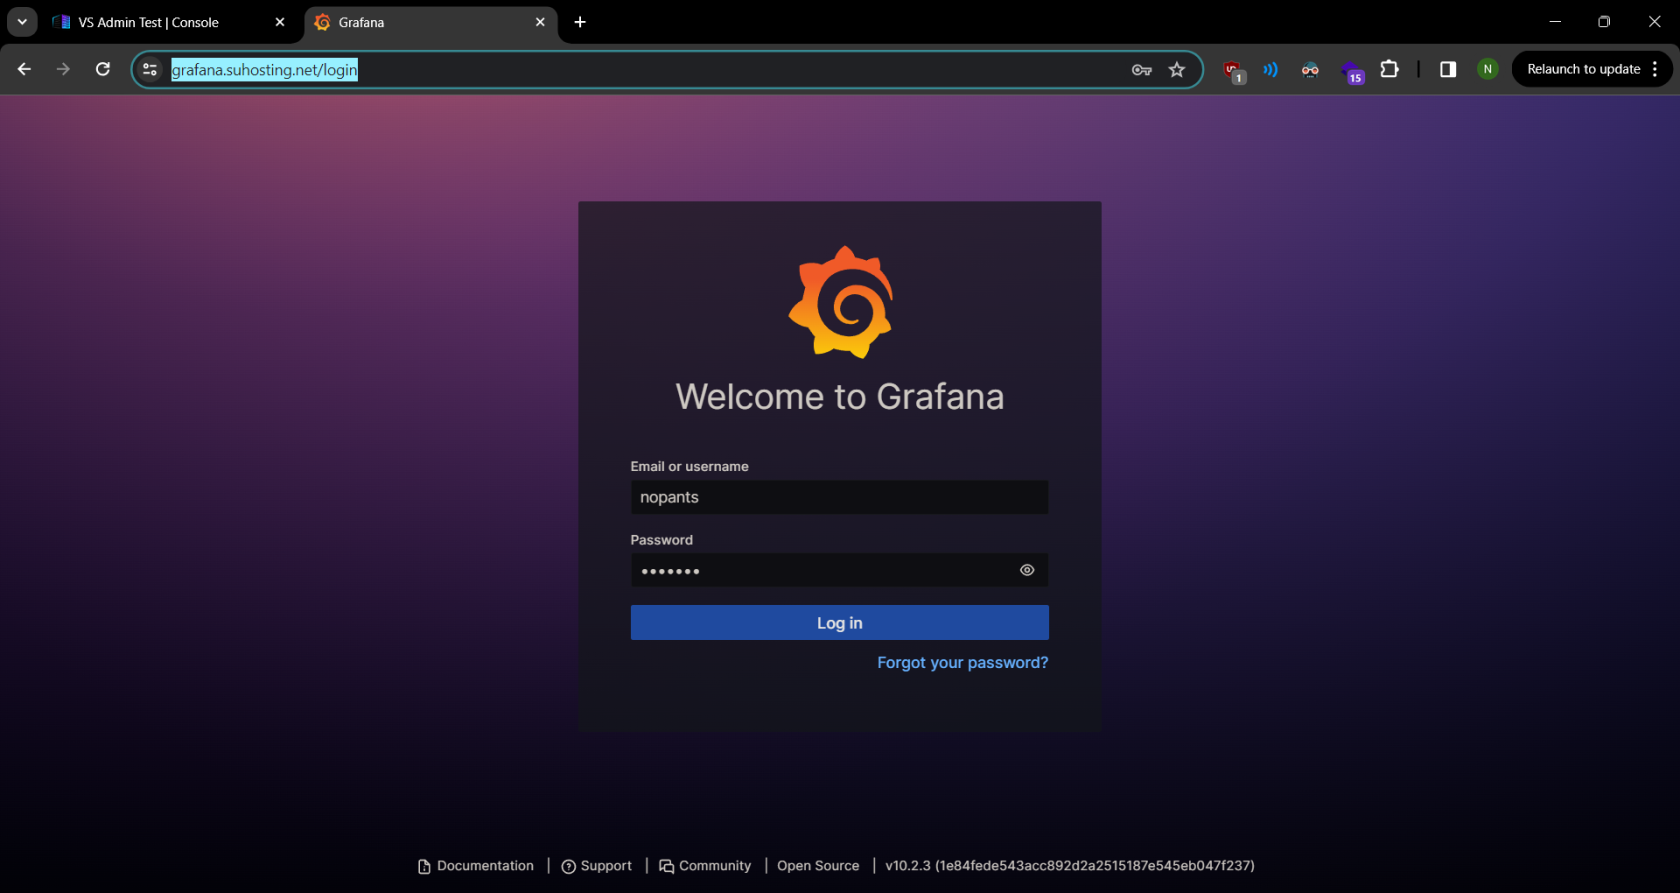
Now we can head over to Grafana and check out our data!
Use the username and password you created when buying the product. Email unfortunately doesn't appear to work at this time. In the event you have forgotten your password please submit a ticket on our billing site.
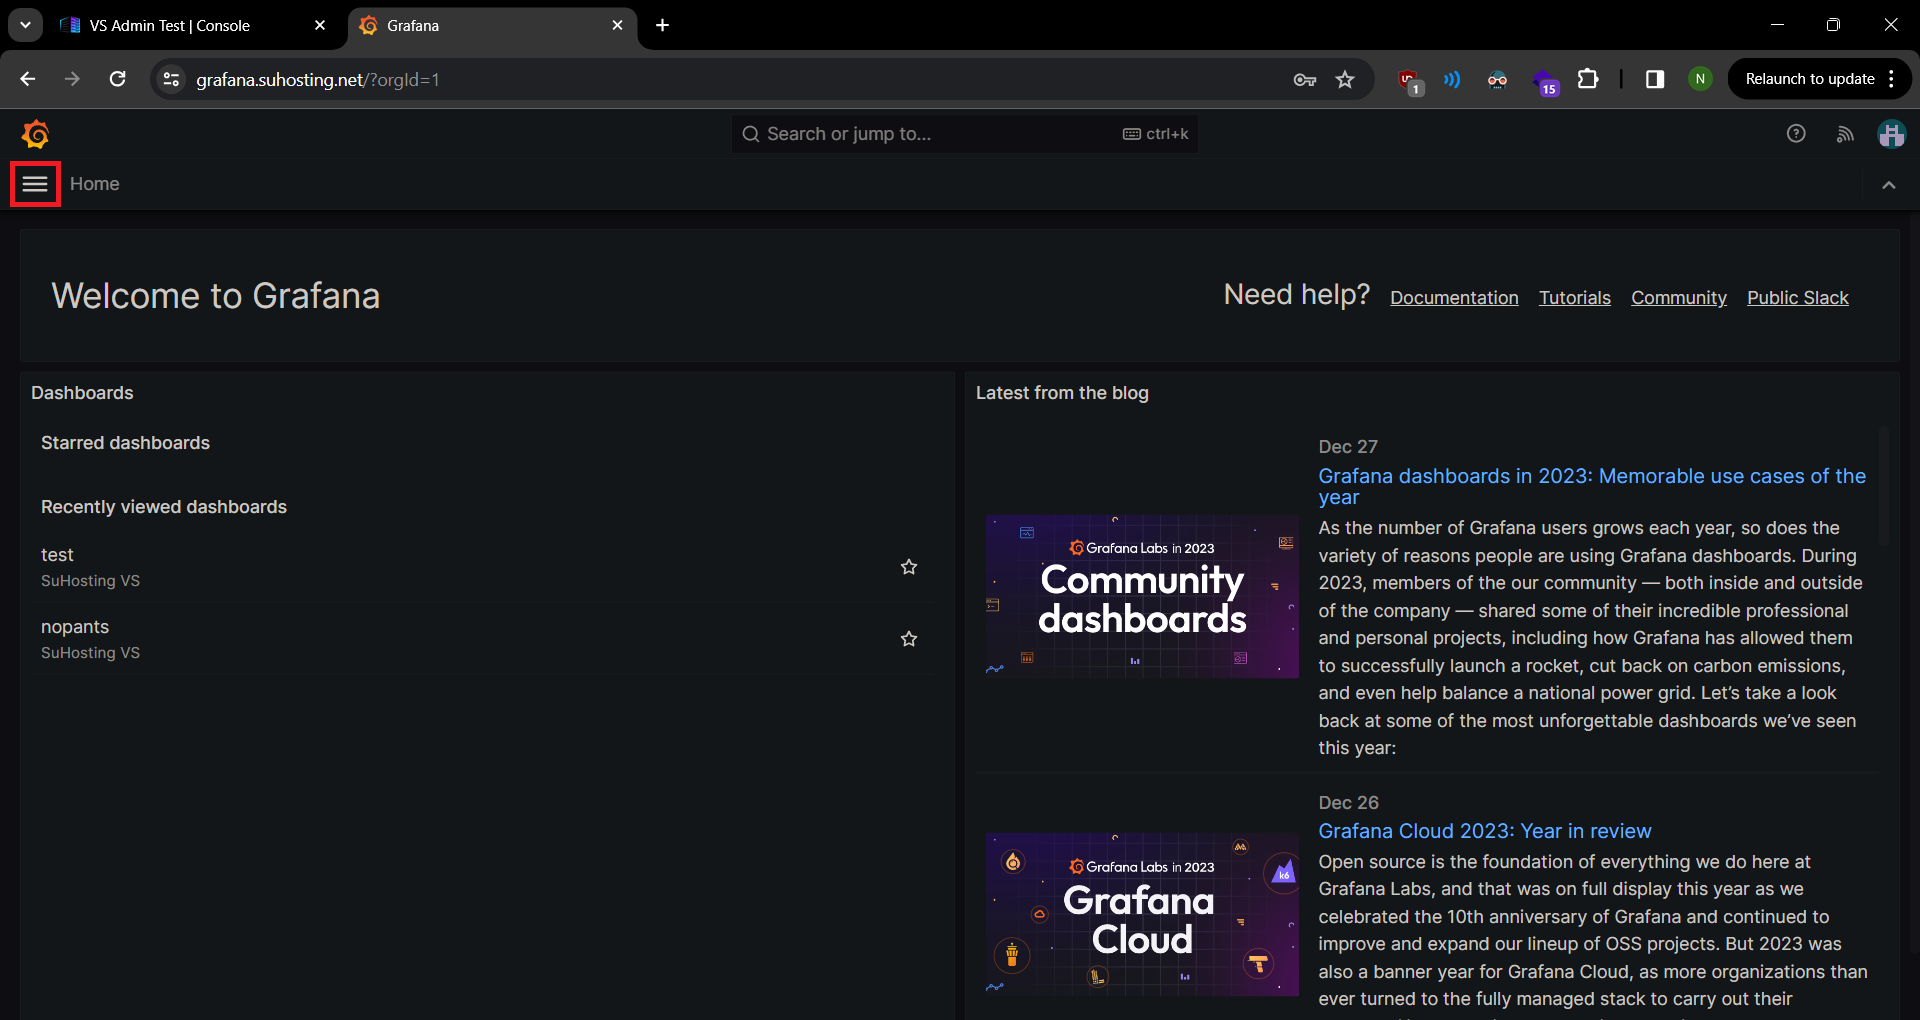
Once you are logged in you will be greeted with this page. Click the 3 bars in the top left of the page (in the red square).
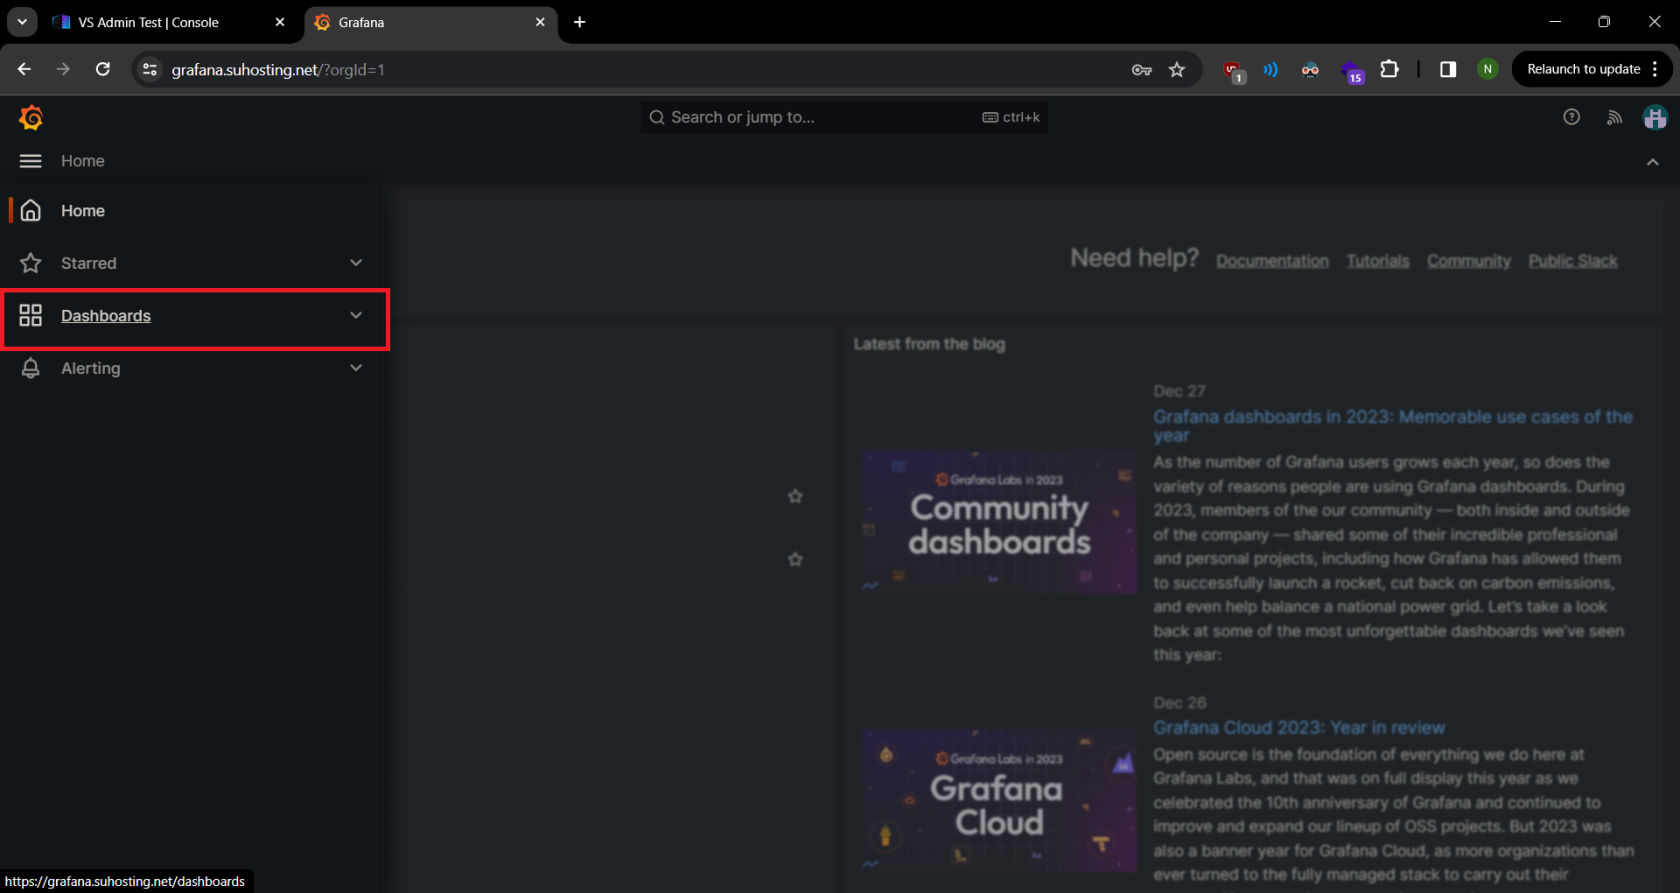
After that click the "Dashboards" button (highlighted in the red square).
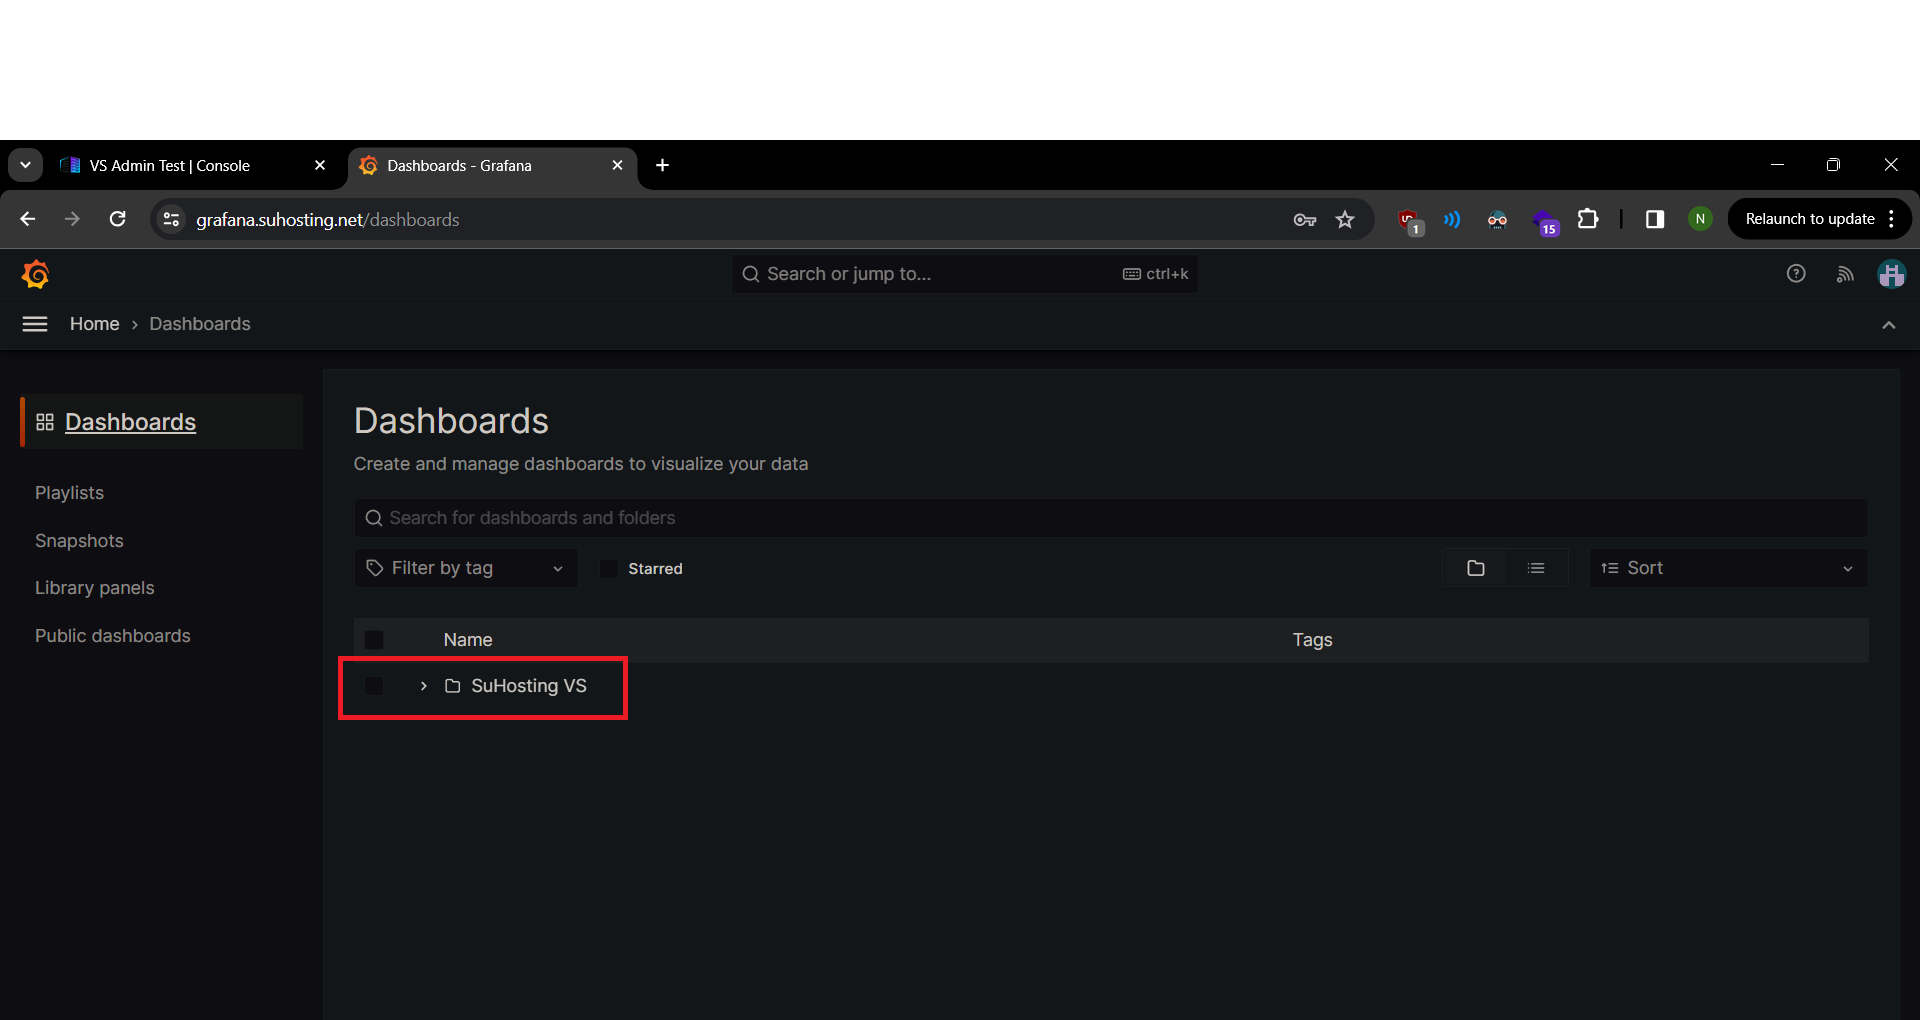
Now we click into the "SuHosting VS" folder and we should see the dashboards that have been assigned to you.
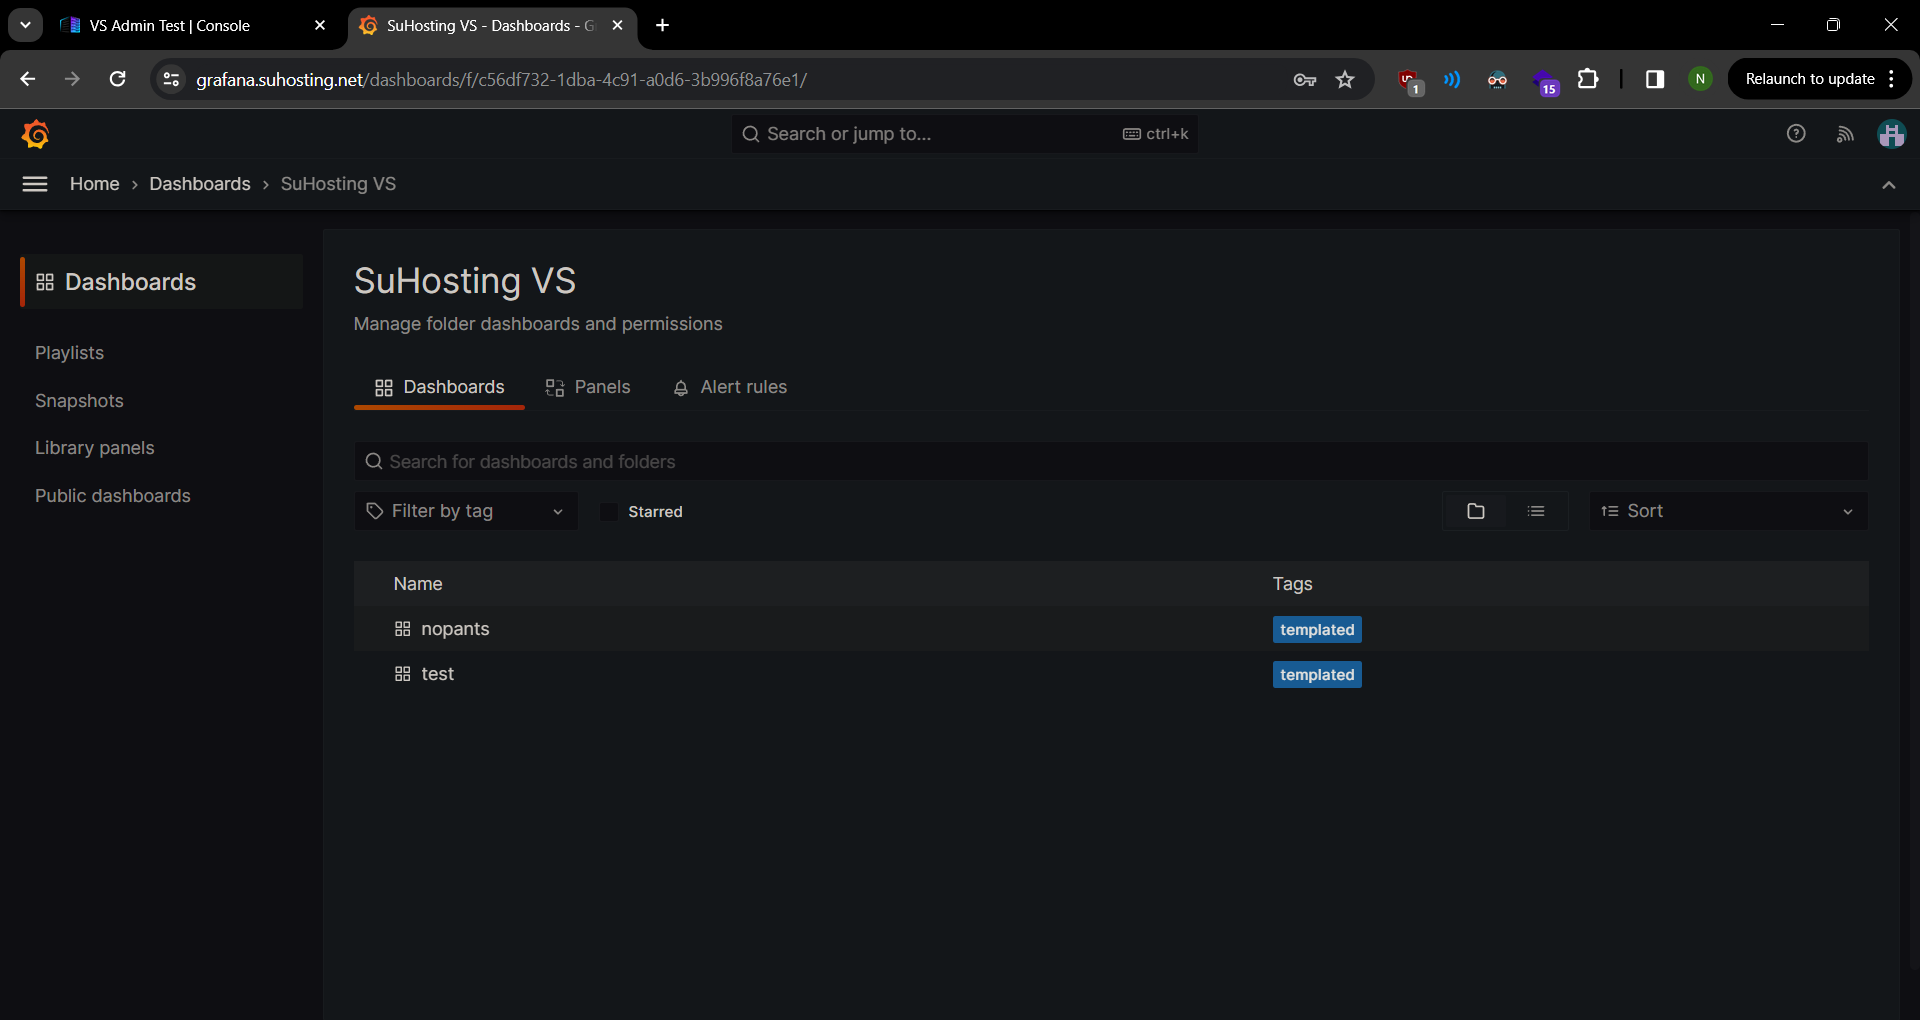
Here you should see a dashboard named whatever you named it when you bought the product. Simply click that and head into the dashboard.
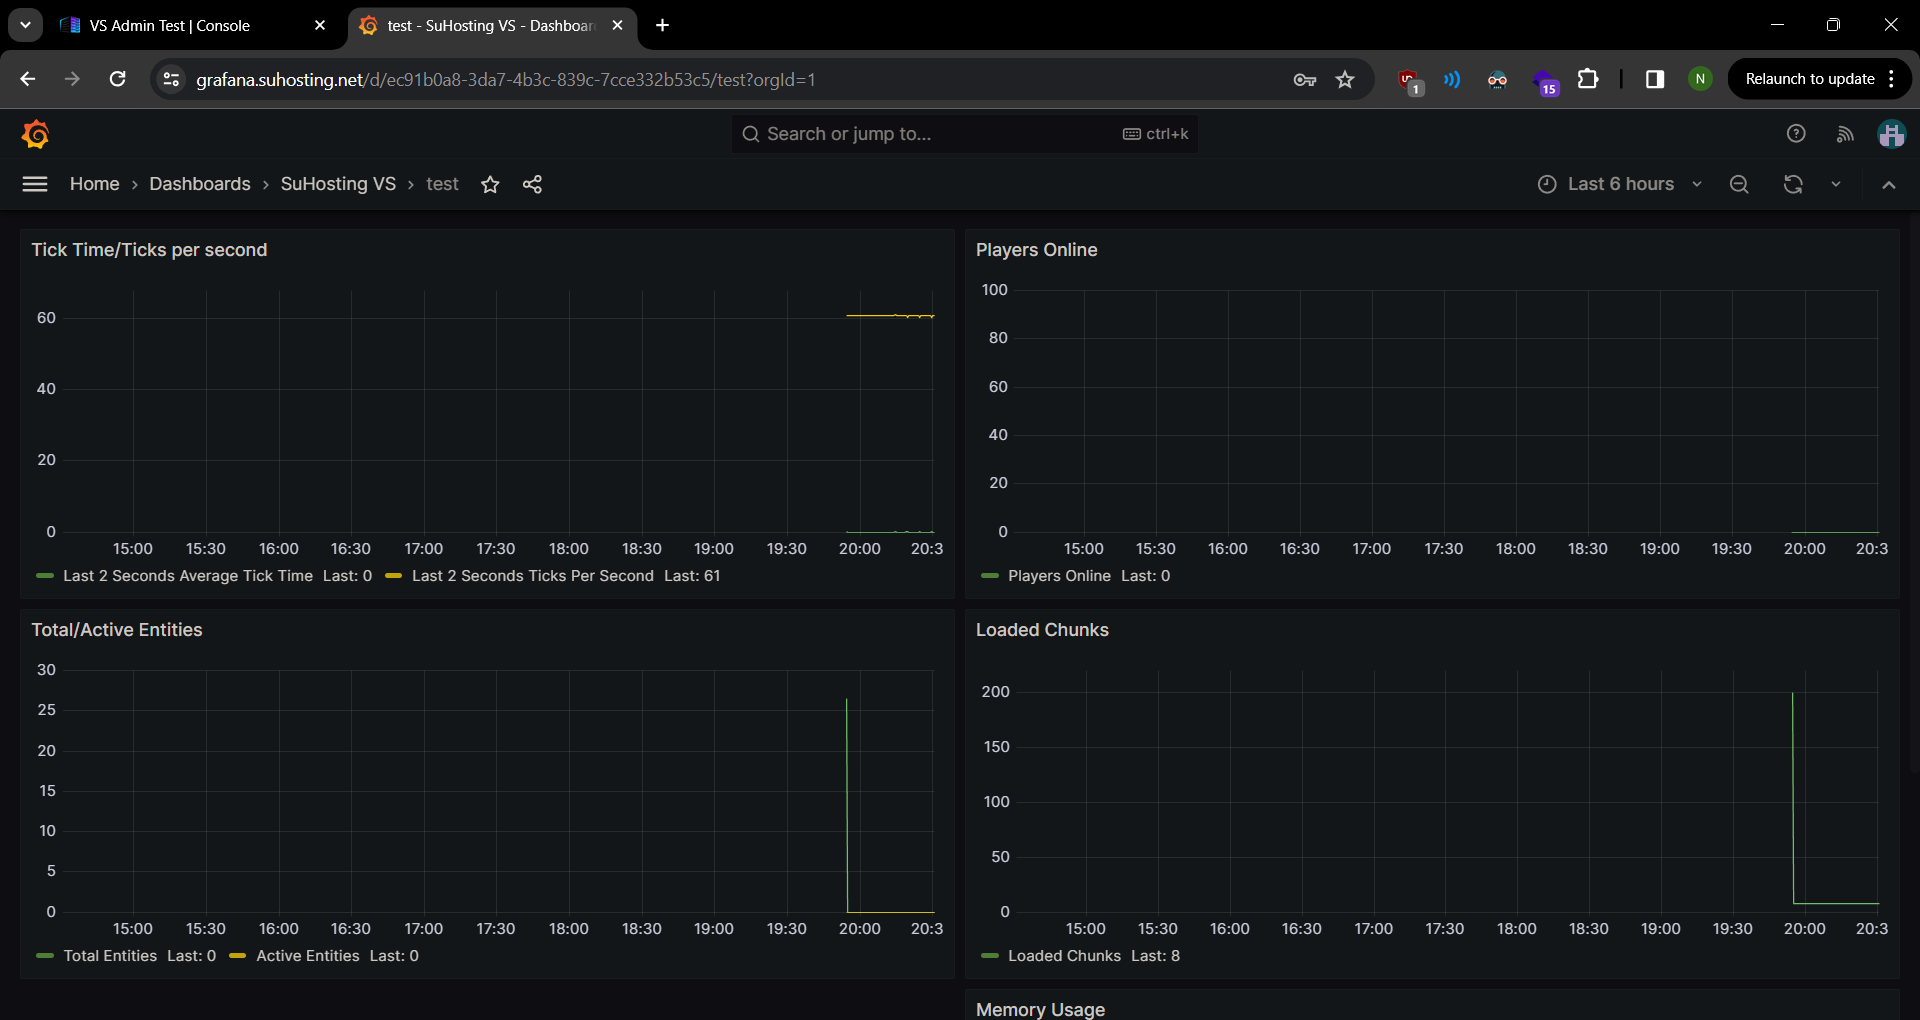
Finally we're into the Grafana Dashboard! Here we have a very generic layout showing all of the stats that Temporalog shows. This is all editable by you and can be changed however you like! You can add more panels, modify existing ones, ect.
Grafana has a very steep learning curve and there's plenty of guides out there for your reading pleasure on what all can be done. If you have any questions or concerns or just need help making it look how you want please reach out to us and we will assist the best we can.

